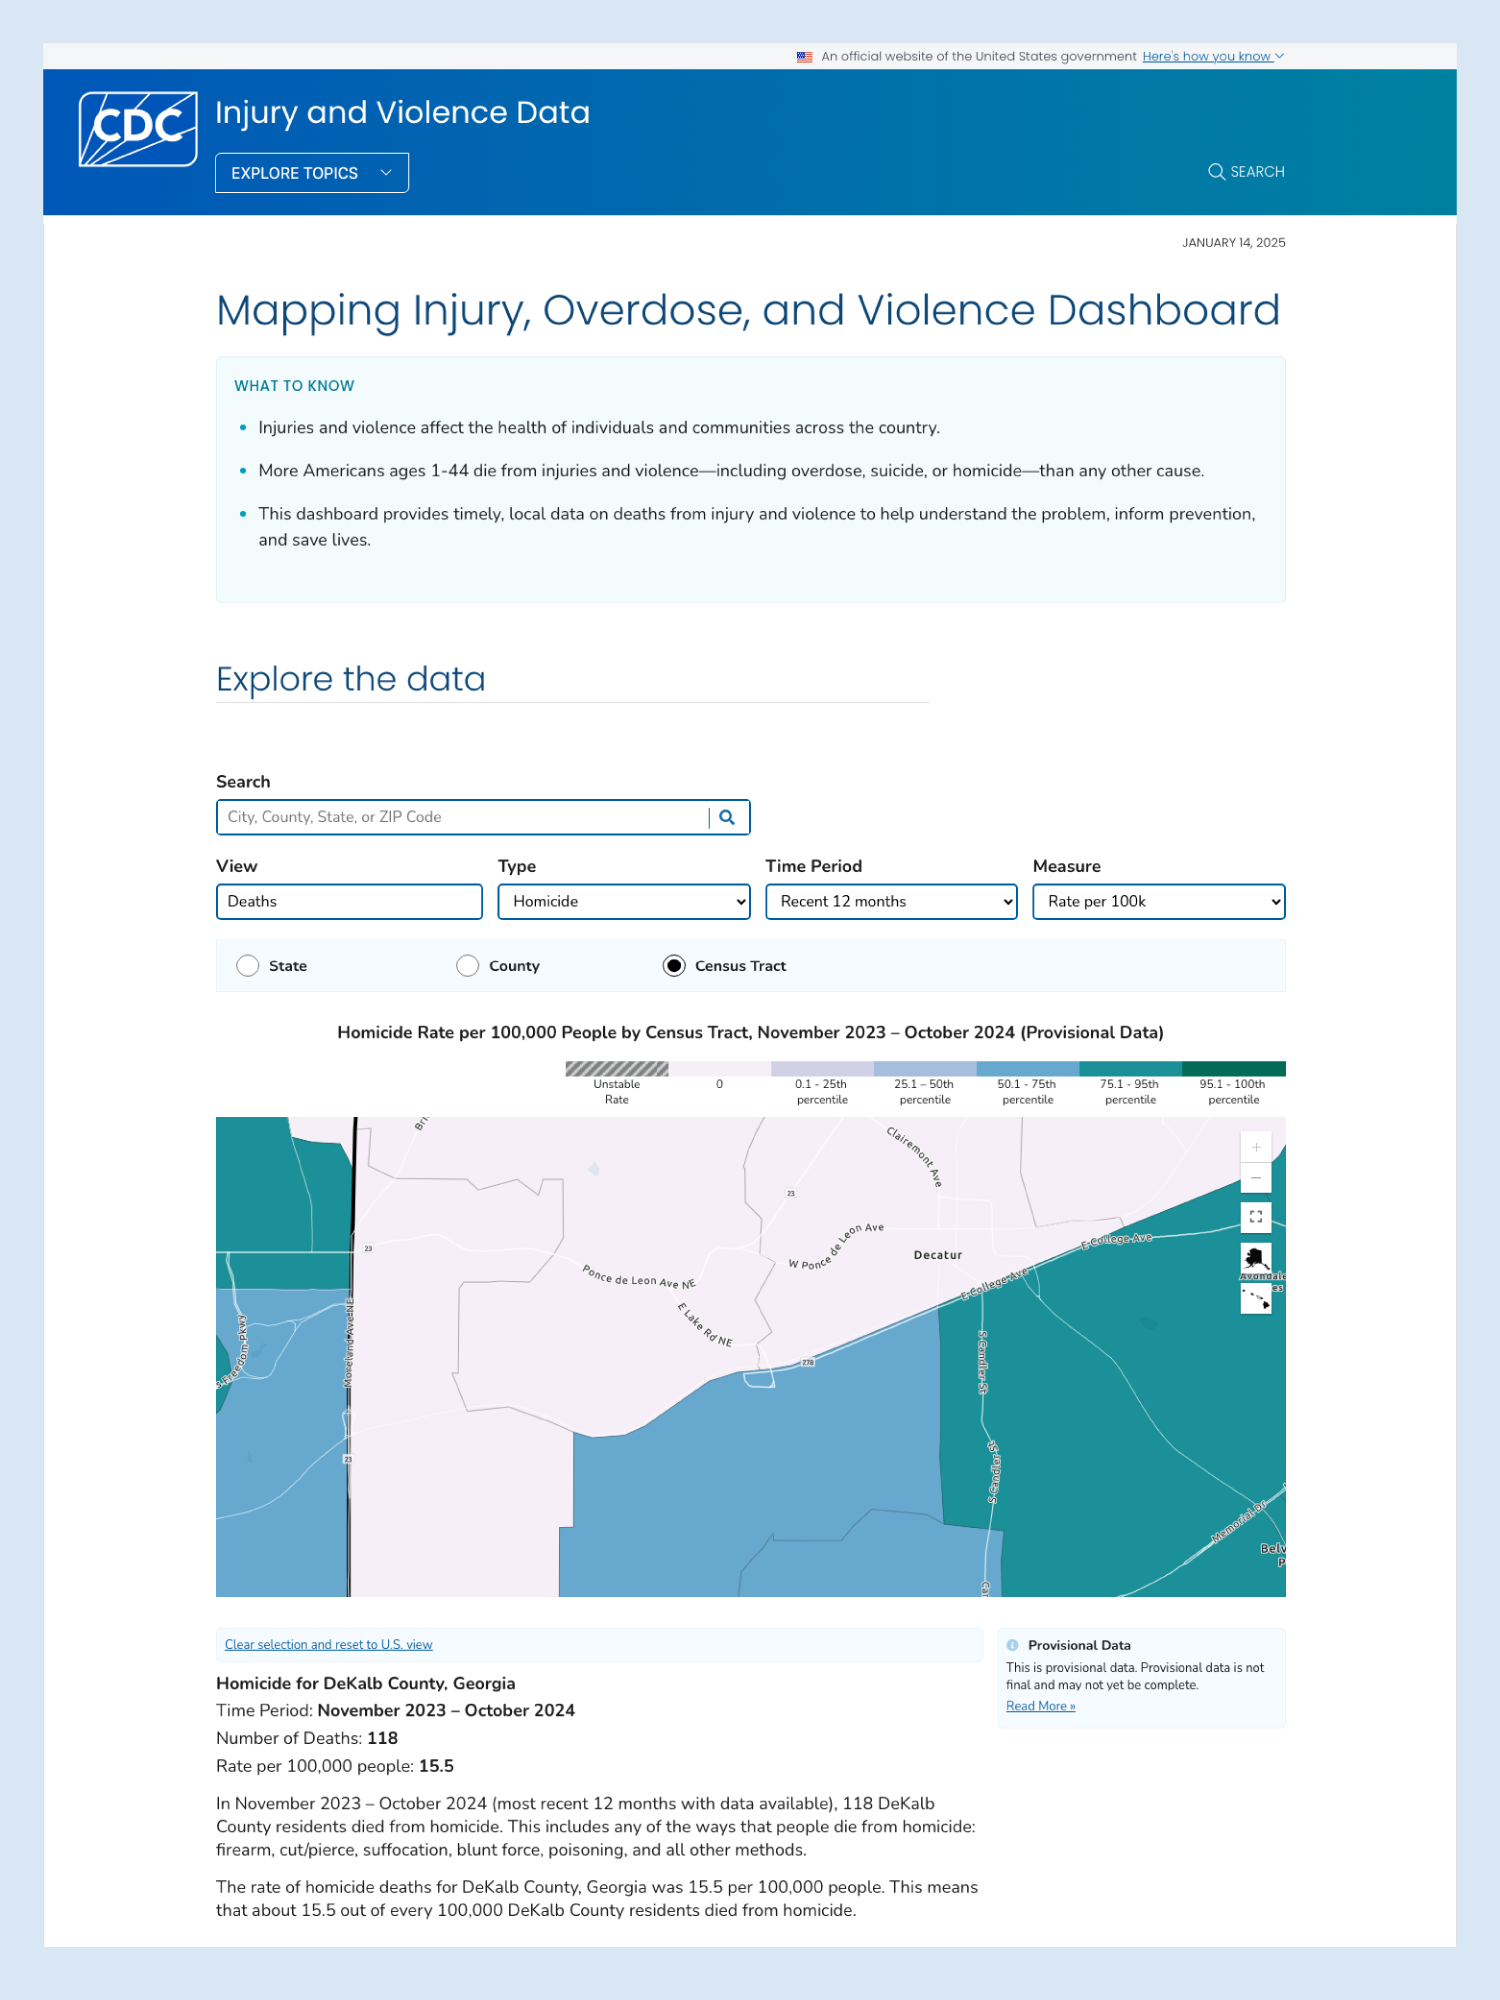
National Injury and Violence Map for CDC
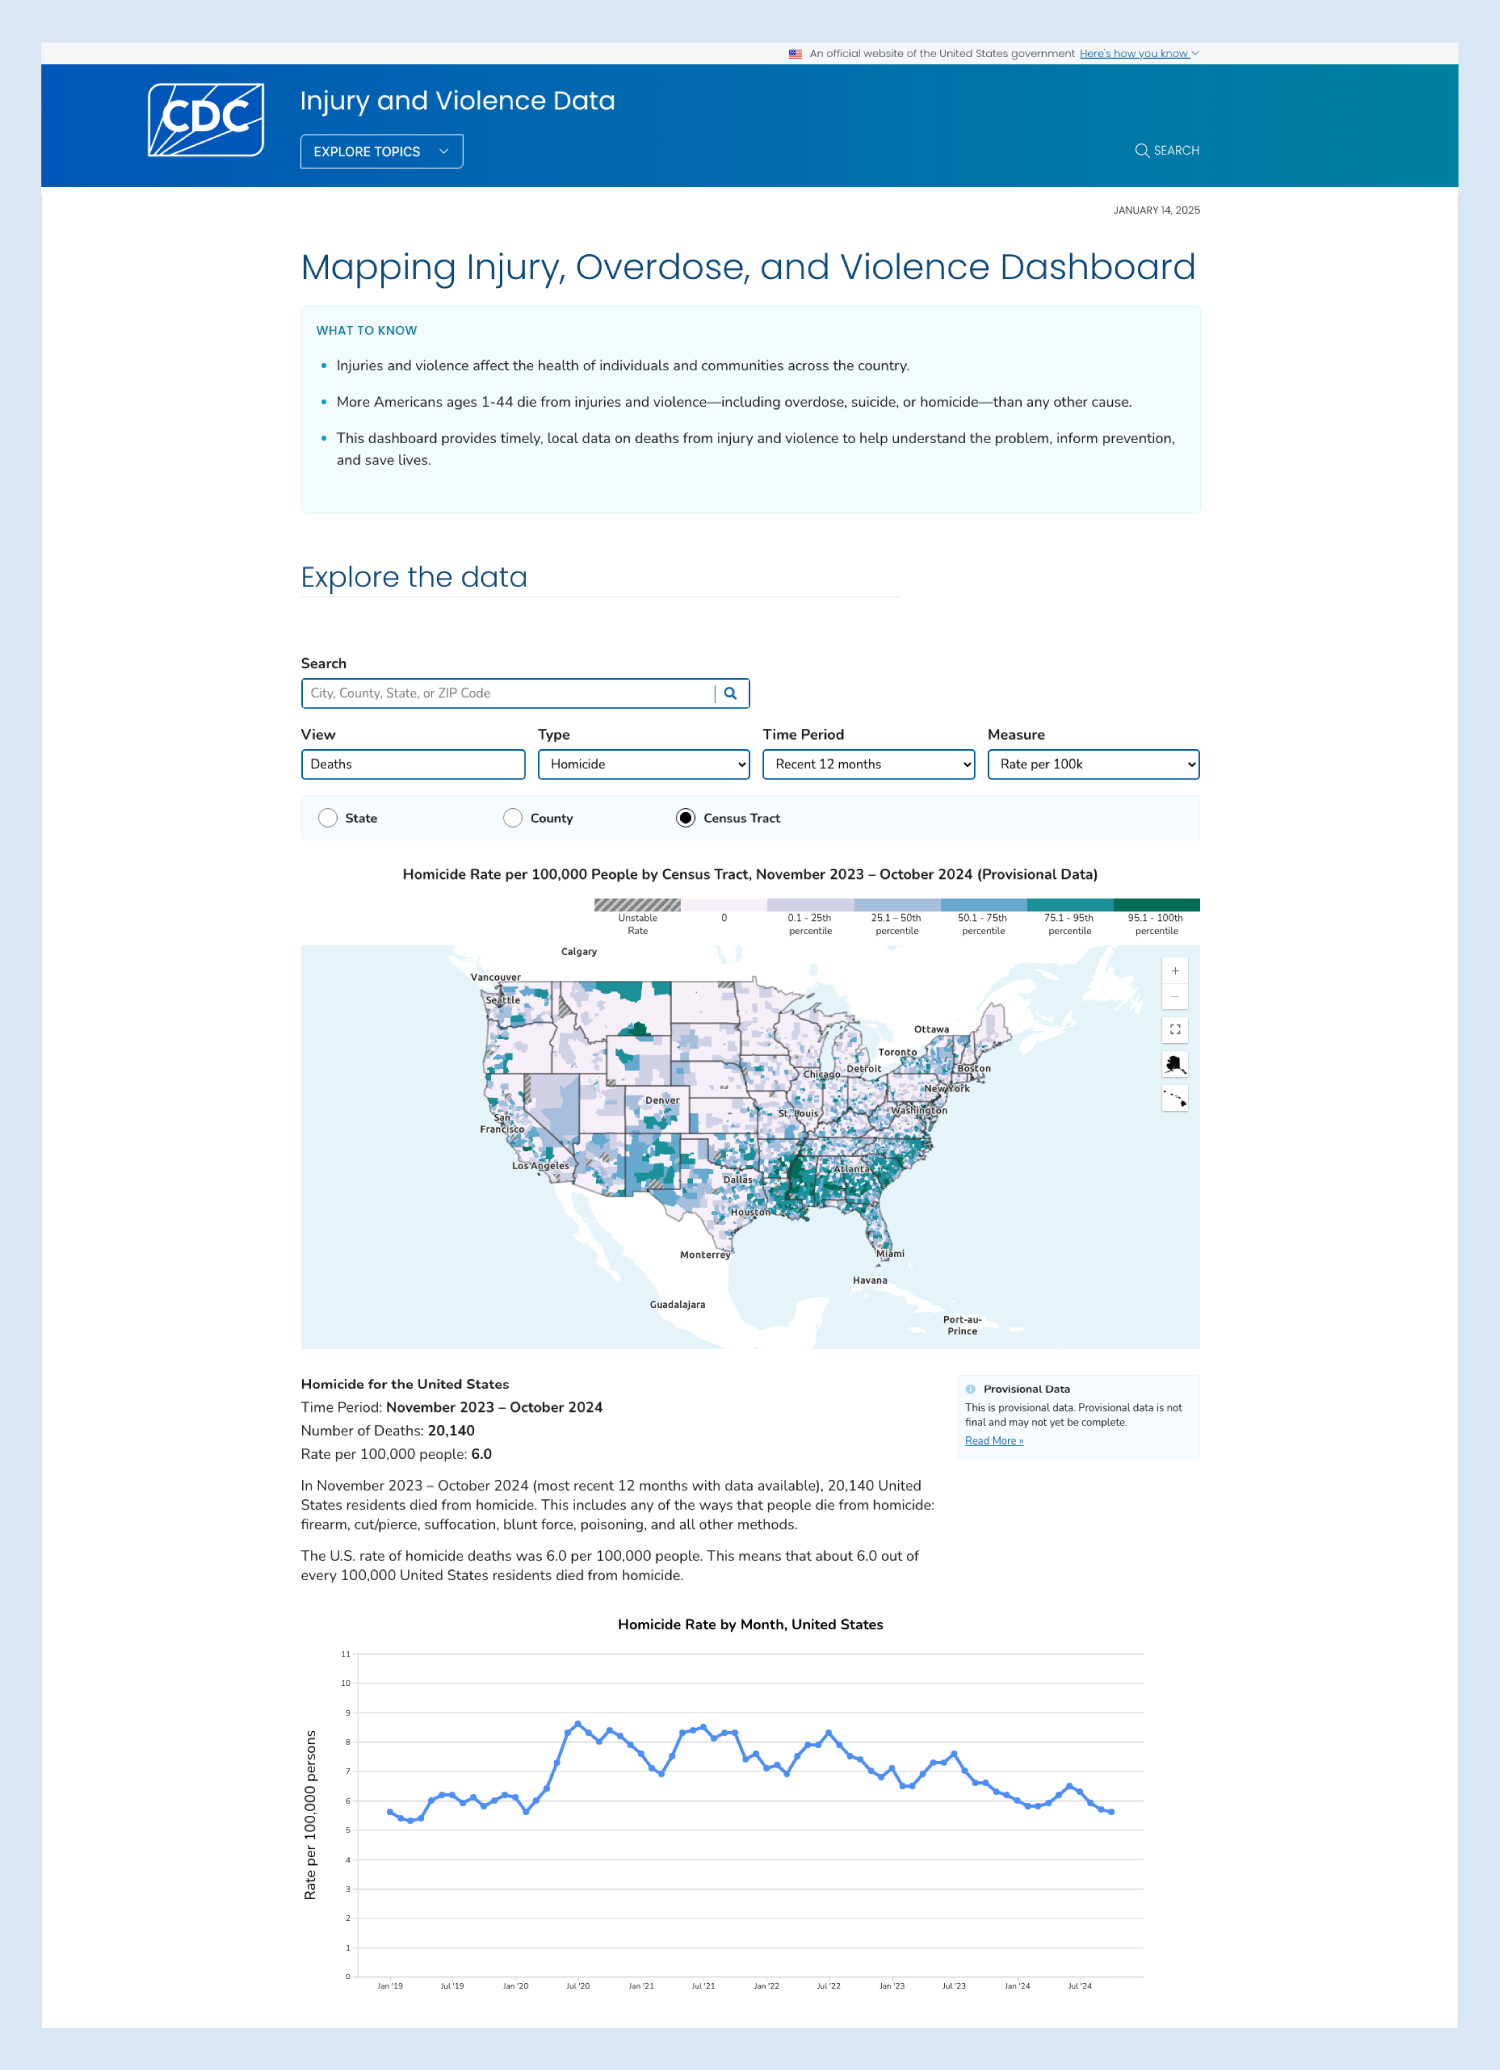
Developed for the National Center for Injury Prevention and Control, this dashboard allows users to explore local, state, and national data on deaths from drug overdose, suicide, and homicide.
The Problem
There was not a site that brought violence and injury data together in one place, presented it in an easy-to-understand visual format.
Requirements Gathering
Leadership/Business Goals:
Promote prevention
Provide timely, local data on injury incidents, allowing users to identify areas of greatest burden and understand the context around it
Present clear, compelling visualizations that convey burden/harm to users
Leadership/Business Requirements:
Curate the user experience for a variety of user flows, from the macro to the micro levels of filtered data
Connect geography-based data to a time series
Overarching User Statement:
What's going on in my neighborhood?
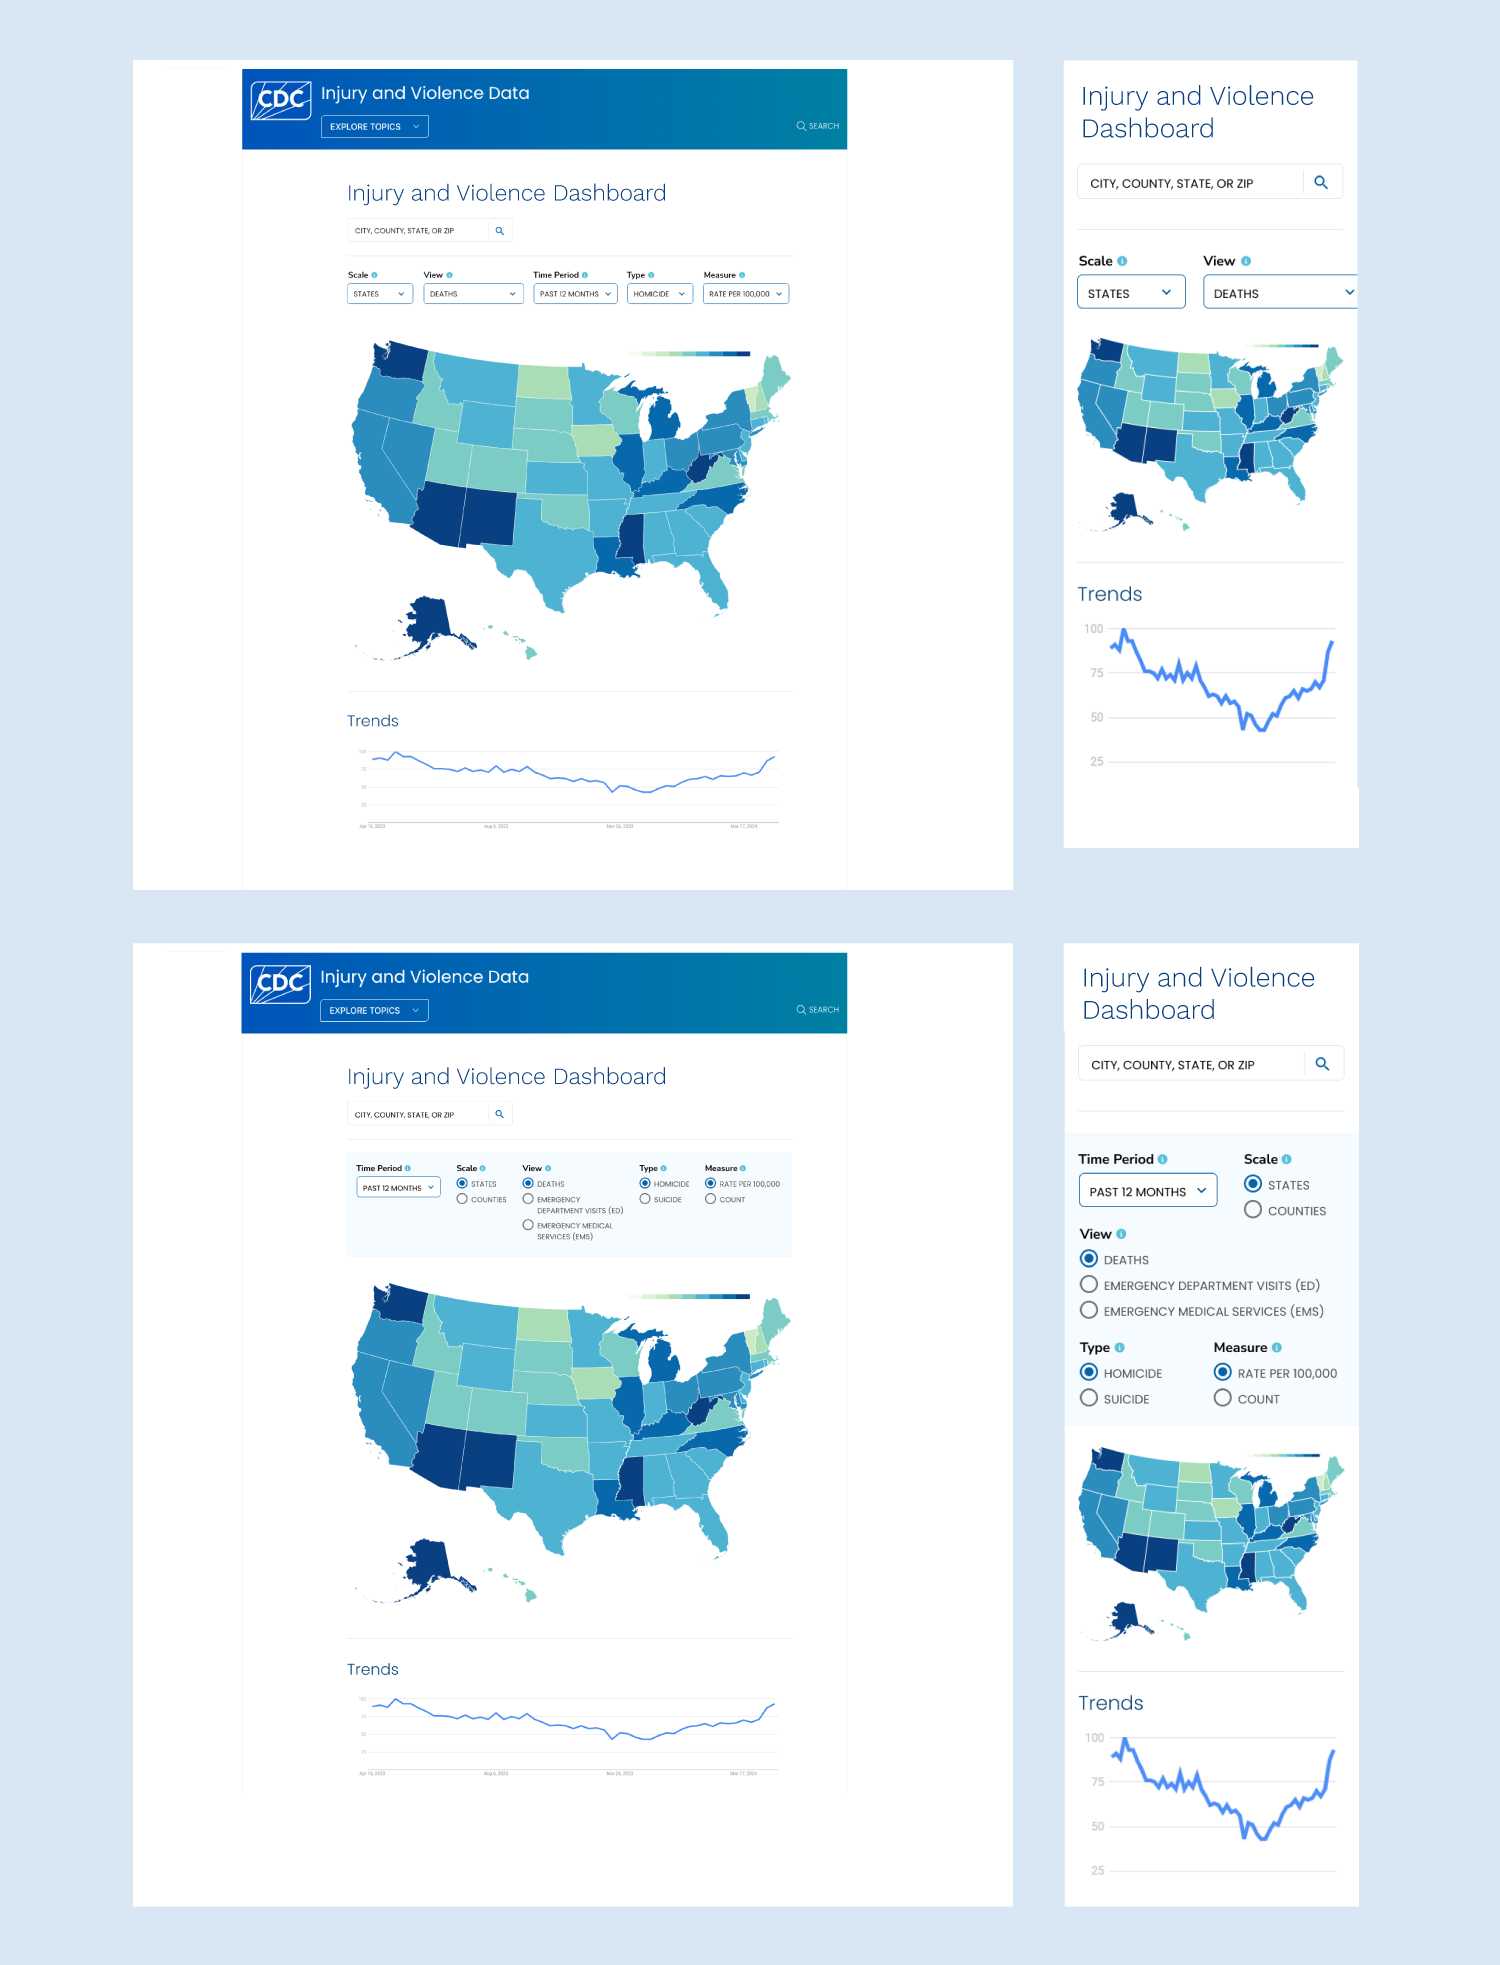
Initial concept prototype, designed in AdobeXD (desktop and mobile views)
Data is fictional, used for presentation purposes
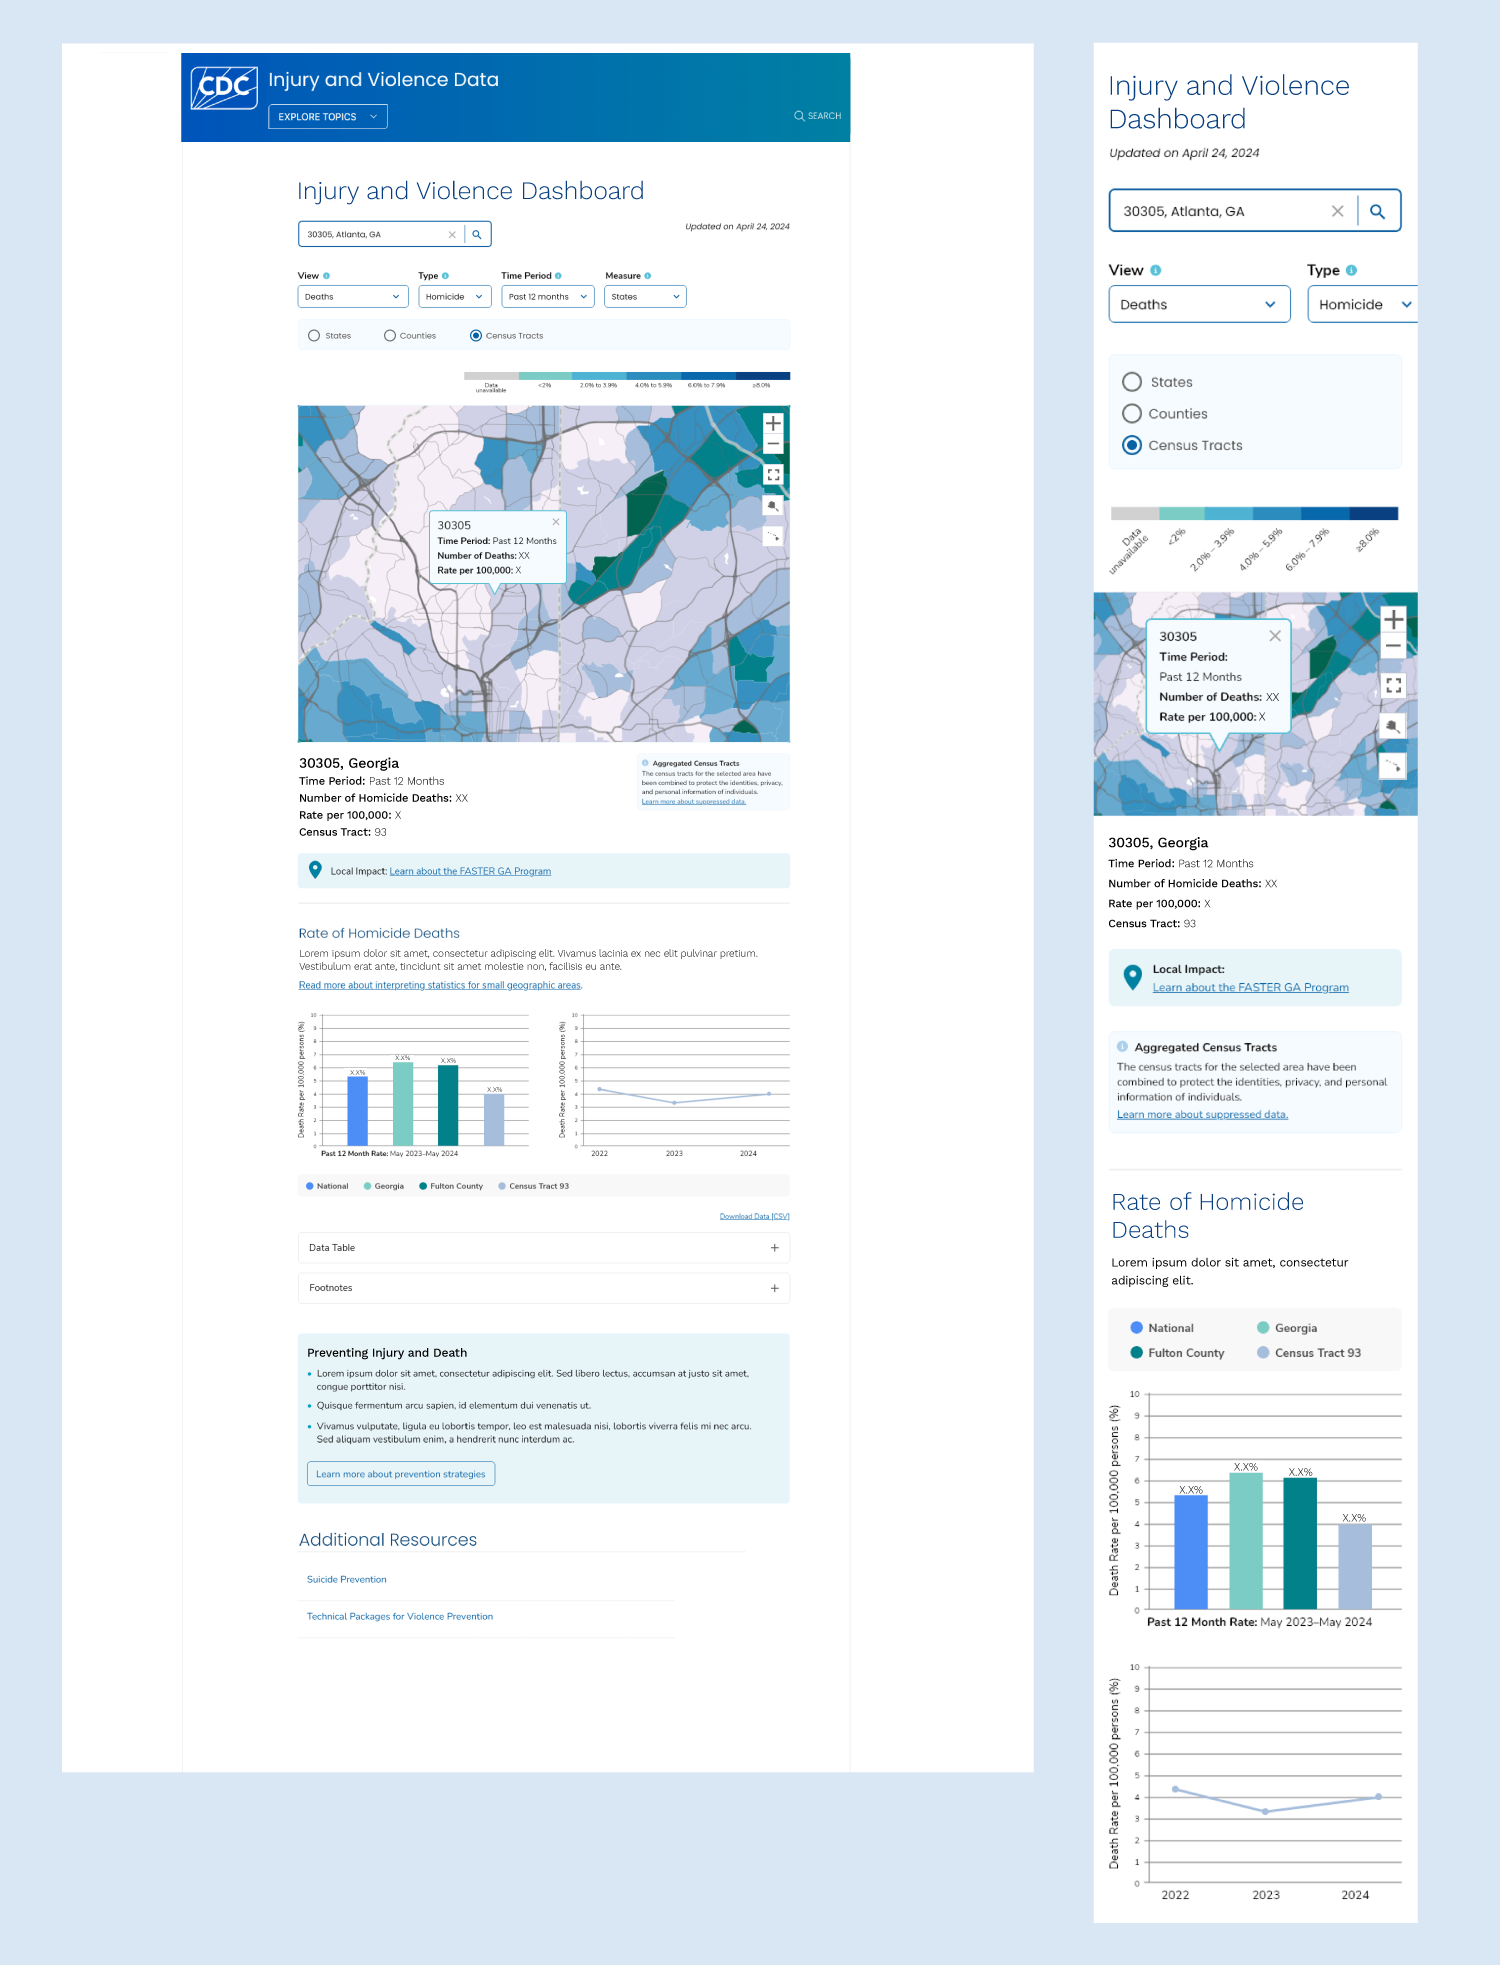
Sample user flow from prototype, designed in AdobeXD (desktop and mobile views)
The Solution
As opposed to an out-of-the box dashboard template, we customized the experience to display data in an intuitive way. Providing space for explanatory content, we worked to simplify what can sometimes be an overly-complicated user-interface.
Who is the user?
Three user types were identified:
The General Public
Policymakers and researchers
Journalists
With these three categories of users in mind, we developed user needs statements to test against the working prototype. Some sample needs include:
I want to understand how my community is being impacted.
I want to know where to direct resources.
I want to see trends and compare against other data sets.
Results
With a successful launch in January of 2025, users are able to explore map-based data, starting from the smallest census tract and zooming out to a national scale. Additionally, the user-interface provides contextual information in an intuitive way, while linking to prevention and educational resources.


